2D Functions
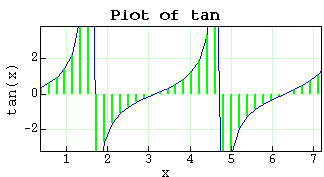
Tangent
plot( tan, 0, 3*pi, 50, "vertical:2:green", "title:Plot of tan", "labels:x:tan(x)" )