2D Polar Plots
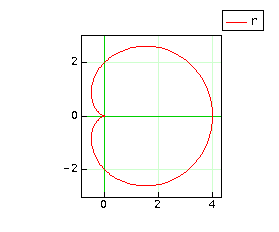
Cardioid
r(t) = 2*(1 + cos(t) )
plot( r, 0, 2*pi, 200, "polar", "color:red", "frame:#00cc00" )