2D Polar Plots
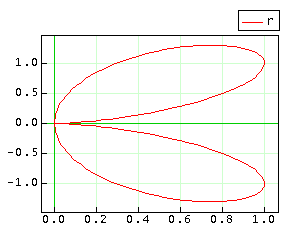
Double folium
r(t) = 4*cos(t)*sin(t)^2
plot( r, 0, 2*pi, 200, "polar", "frame:#00cc00" )