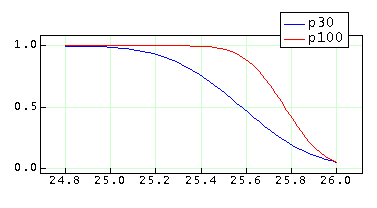
Figure 1. Power as a function of the true mean for a sample size of n=30 and n=100.
The following tests have been implemented. You may consult the Function Reference for detailed use and examples. The tests compute the confidence intervals, margin of error and print some other useful information.
ci_onesample_z()).
ci_onesample_t()).
Function ci_onesample_zreqsize() returns the sample size required to compute a confidence level for the mean with margin of error E, known standard deviation std, and confidence level cl.
The following tests have been implemented. You may consult the Function Reference for detailed use and examples. The tests compute P values, print useful information and a message indicating the outcome of the test.
ht_onesample_z()).
ht_onesample_t()).
ht_onesample_wilcoxon()).
Function ht_onesample_ztypeIIerror() returns the probability of making the Type II Error associated with the Z-Test above.
Function ht_onesample_zpower() returns the Power (Power=1-P(Type II error)).
(See NOTE below)
For example, given a mean equal to 26, a sample size of 30, a standard deviation equal to 1.4, a 0.05 significance level, a true mean equal to 25, and assuming this is a left tail test (type=0), then the power (probability of making the Type II Error) is:
You may build a function that returns the power as a function of the true mean for different values of the other parameters. For example, for n=30 and n=100, the following two functions return the power as a function of the true mean. A plot of the functions is also presented.
The following tests have been implemented. You may consult the Function Reference for detailed use and examples. The tests compute the confidence intervals, margin of error and print some other useful information.
ci_twosample_tpooled()). Both standard deviations are assumed equal.
ci_twosample_tnonpooled()). Standard deviations are not assumed equal.
ci_twosample_tpaired()). Test for paired samples.
The following tests have been implemented. You may consult the Function Reference for detailed use and examples. The tests compute P values, print useful information and a message indicating the outcome of the test.
ht_twosample_tpooled()). Test assumes samples have equal standard deviations.
ht_twosample_tnonpooled()). Test assumes samples do not have equal standard deviations.
ht_twosample_mannwhithney()) for same-shape, independent samples.
ht_twosample_tpaired()) for paired samples.
ht_twosample_pairedwilcoxon()) for paired samples which have symmetric differences.
The following functions have been implemented. They print useful information and a message with the outcome of the test. Detailed information and examples of use can be found in the Function Reference.
ci_onesample_std()).
ci_twosample_std()).
ht_onesample()).
ht_twosample_std()).
The following functions have been implemented. They print useful information and a message with the outcome of the test. Detailed information and examples of use can be found in the Function Reference.
ci_onesample_pro()).
ci_onesample_reqsize()).
ht_onesample_pro()).
ci_twosample_pro()).
ci_twosample_reqsize()).
ht_twosample_pro()).
The following functions have been implemented. They print useful information and a message with the outcome of the test. Detailed information and examples of use can be found in the Function Reference.
chi2_goodness()).
chi2_independent()).
chi2_totable()).
NOTE: The data used in this example was taken from the textbook Introductory Statistics 6th Ed. by Neil A. Weiss with kind permission of Addison Wesly Longman, Inc. (AWL). AWL does not endorse nor it supports the Calcugator.