 More information
boxwhiskers(a, options)
Draws a box-and-whiskers plot using the contents of matrix a.
See also xychart pie barchart pareto
Example
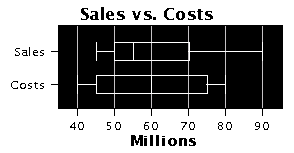
a=( "Sales", 45, 50, 55, 70, 90 ; "Costs", 40, 45, 60, 75, 80)
"Sales" 45 50 55 70 90
"Costs" 40 45 60 75 80
boxwhiskers( a, "title:Sales vs. Costs", "labels: :Millions", "background:black", "white", "grid:lightGray", "tickmarks:0:10", "horizontal")
