 More information
xychart(x, y, options)
Draws an xy chart using the contents of arrays x, y.
See also barchart boxwhiskers pareto pie
Example
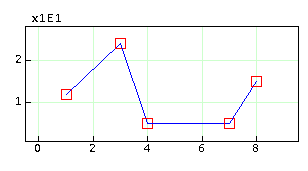
x = ( 1, 3, 4, 7, 8 )
1 3 4 7 8
y = ( 12, 24, 5, 5, 15 )
12 24 5 5 15
xychart( x, y, "line", "blue", "square:nofill:red:10" )
