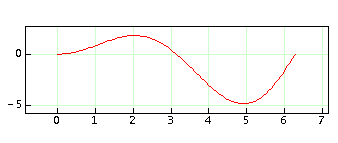
Function plot() accepts several options to customize your plots.
To try the examples below you may use this function:
f(x)=x*sin(x)

NOTE: Words in italics are to be replaced by numbers or keywords.
"color"
Sets the color of the line or surface. You may use the keywords "black", "blue", "cyan", "darkGray", "gray", "green", "lightGray", "magenta", "orange", "pink", "red", "yellow" or "white". Also, the color may be specified in hexadecimal format preceded by the # sign.
plot(f, 0, 6, 50, "red" )
plot(f, 0, 6, 50, "#fa568b" )
"atext:text:x:y"
Defines an annotation text. The string text will located at point (x, y) on the coordinate system being drawn. This text moves with the plot if you zoom or pan.
plot(f, 0, 6, 50, "text:Hello:2:4")
"axes:color"
Uses the specified color to draw the frame and tickmarks surrounding the plot.
plot(f, 0, 6, 50, "axes:lightGray")
"background:color"
Paints the background of the plot using the specified color.
plot(f, 0, 6, 50, "background:lightGray")
"bar:width:color"
"bar:width:color:nofill"
Draws vertical bars of the specified width (in user units) and color. Both size and color are optional. Only the outline is drawn if the option nofill is specified. Option "vertical" works the same way except that the size is in pixels.
plot(f, 0, 6, 50, "bar:0.257")
"canvas:color"
Fills the background canvas using the specified color.
plot(f, 0, 6, 50, "canvas:#dddddd")
"circle:size:color"
"circle:size:color:nofill"
Draws circular markers of the specified size and color. Both size and color are optional. Only the outline is drawn if the option nofill is specified.
plot(f, 0, 6, 50, "circle:10:green" )
"ctext:text:i:j"
Defines a canvas text. The string text will be located at the canvas point (i, j) following java's convention to draw on a canvas, that is, the origin of coordinates is the top left corner of the canvas, the x axis runs positive to the right and the y axis run positive downward. The position of this text is not changed if you zoom or pan.
plot(f, 0, 6, 50, "ctext:20:50")
"font:name:size:style:color"
Set the current font using the given name. The size size is in pixels. The style style is one of these: plain, italic, bold, bolditalic. Options "atext" and "ctext" after will be drawn with the font just set.
plot(f, 0, 6, 50, "font:Arial:20:bold:red")
"frame:color"
Draws a coordinate system using the specified color. The color is optional
plot(f, 0, 6, 50, "frame:red")
"grid:color"
Uses color color to draw the grid.
plot(f, 0, 6, 50, "grid:lightGray")
"labels:xtext:ytext"
Draws the text xtext along the x axis and draws the text ytext along the y axis.
plot(f, 0, 6, 50, "labels:t(seconds):Force(Newtons)"
"legendbackground:color"
Uses color to draw the background of the legend.
plot(f, 0, 6, 50, "legendbackground:red")
"line"
Does draw the lines connecting the points. By default, x-y charts do not connect the points.
x=(1, 2, 3)
y=(-4, 7, 2)
xychart(x, y, "line")
"name:text"
Uses the specified text as the name of the function in the legend.
plot(f, 0, 6, 50, "name:Velocity")
"noaxes"
Removes the frame and tickmarks surrounding the plot.
plot(f, 0, 6, 50, "noaxes")
"noframe"
Removes a previously specified frame.
plot(f, 0, 6, 50, "noframe")
"nogrid"
Removes the grid from the plot.
plot(f, 0, 6, 50, "nogrid")
"nolegend"
Removes the legend from the plot.
plot(f, 0, 6, 50, "nolegend")
"noline"
Does not draw the lines connecting the points. Useful in combination with say "square" or "circle" or other markers.
plot(f, 0, 6, 50, "noline", "square:10:nofill"
"plus:size:color"
Draws markers shaped like a plus sign of the specified size and color. Both size and color are optional.
plot(f, 0, 6, 50, "plus:10:green" )
"polar"
Draws the plot in polar form.
plot(f, 0, 6, 50, "polar")
"rhombus:size:color"
"rhombus:size:color:nofill"
Draws markers shaped like a rhombus of the specified size and color. Both size and color are optional. Only the outline is drawn if the option nofill is specified.
plot(f, 0, 6, 50, "rhombus:10:green" )
"square:size:color"
"square:size:color:nofill"
Draws square markers of the specified size and color. Both size and color are optional. Only the outline is drawn if the option nofill is specified.
plot(f, 0, 6, 50, "square:10:green" )
"star:size:color"
Draws star markers of the specified size and color. Both size and color are optional.
plot(f, 0, 6, 50, "star:10:green" )
"step:value:offset"
Draws the markers beginning at offset offset and skips value-1 markers before drawing the next one.
In this example, the first marker is located in the 4th point and the others are spaced 7 points.
plot(f, 0, 6, 50, "circle:8", "step:4:8"
"swap"
Swaps the coordinate axes. Axis x is now vertical while axis y is horizontal.
plot(f, 0, 6, 50, "swap")
"title:text"
Draws a title using the specified text.
plot(f, 0, 6, 50, "title:Simple Variation")
"triangle:size:color"
"triangle:size:color:nofill"
Draws triangular markers of the specified size and color. Both size and color are optional. Only the outline is drawn if the option nofill is specified.
plot(f, 0, 6, 50, "triangle:10:green" )
"vertical:size:color"
"vertical:size:color:nofill"
Draws vertical bars of the specified size and color. Both size and color are optional. Only the outline is drawn if the option nofill is specified.
plot(f, 0, 6, 50, "vertical:10" )
"window:xmin:xmax:ymin:ymax"
Defines the window that will be mapped into the canvas. xmin, xmax, ymin and ymax define the window's dimensions.
plot(f, 0, 6, 50, "window:0:10:-2:2" )
"xrad"
"xrad:num:den"
Draws tickmarks with a spacing equal to a fraction of Pi. The spacing is num*Pi/den where both num and den are given integers. The default values are 1 and 2 respectively.
plot(f, 0, 6, 50, "xrad")
"xtickmarks:reference:value"
Draws the tickmarks in axis x using the spacing value such that a tickmarks would be located at x=reference.
plot(f, 0, 6, 50, "xtickmarks:1:2.5")
"yrad"
"yrad:num:den"
Draws tickmarks in the y axis with a spacing equal to a fraction of Pi. The spacing is num*Pi/den where both num and den are given integers. The default values are 1 and 2 respectively.
plot(f, 0, 6, 50, "yrad")
"ytickmarks:reference:value"
Draws the tickmarks in axis y using the spacing value such that a tickmarks would be located at y=reference.
plot(f, 0, 6, 50, "ytickmarks:1:2.5")