Function plot3D() accepts several options to customize your plots.
To try the examples below you may use this function:
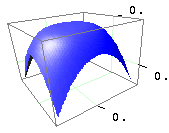
f(x,y)=cos(x*x + y*y)
NOTE: Words in italics are to be replaced by numbers or keywords.
"color"
Sets the color of the line or surface. You may use the keywords "black", "blue", "cyan", "darkGray", "gray", "green", "lightGray", "magenta", "orange", "pink", "red", "yellow" or "white". Also, the color may be specified in hexadecimal format preceded by the # sign.
plot3D(f,-1,1,40,-1,1,40, "red" )
plot3D(f,-1,1,40,-1,1,40, "#fa568b" )
"atext:text:x:y:z"
Defines an annotation text. The string text will located at point (x, y, z) on the coordinate system being drawn. This text moves with the plot if you zoom or pan.
plot3D(f,-1,1,40,-1,1,40, "text:Hello:2:4:2")
"axes:color"
Uses the specified color to draw the frame and tickmarks surrounding the plot.
plot3D(f,-1,1,40,-1,1,40, "axes:lightGray")
"background:color"
Paints the background of the plot using the specified color.
plot3D(f,-1,1,40,-1,1,40, "background:lightGray")
"ball"
"ball:width"
Draws a ball of the specified width (in user units) at each plotting point. This option is useful when plotting raw data stored in arrays.
plot3D(f,-1,1,40,-1,1,40, "ball:.1")
plot3D(x, y, z, "ball:.1")
"bar"
"bar:width"
Draws a vertical bar of the specified width (is in user units) at each plotting point. This option is useful when plotting raw data stored in arrays.
plot3D(f,-1,1,40,-1,1,40, "bar:.1")
plot3D(x, y, z, "bar:.1")
"canvas:color"
Fills the background canvas using the specified color.
plot3D(f,-1,1,40,-1,1,40, "canvas:#dddddd")
"colorbar"
If the option "colormap" is specified, then a color bar legend is drawn to the left of the plot.
plot3D(f,-1,1,40,-1,1,40, "colormap", "colorbar")
"colormap:anglemin:anglemax"
Draws a surface plot with colors from a color map. The minimum value is plotted with the color corresponding to angle anglemin of the Hue circle, and the maximum value is plotted with the color corresponding to angle anglemax of the Hue circle.
plot3D(f,-1,1,40,-1,1,40, "colormap")
"contour"
"contour:reference:spacing"
Draws a contour plot of the function. The contour lines are selected such that one is located at z=reference and the others have the specified spacing.
plot3D(f,-1,1,40,-1,1,40, "contour:0:.2")
"cube"
"cube:width"
Draws a cube of the specified width (in user units) at each plotting point. This option is useful when plotting raw data stored in arrays.
plot3D(f,-1,1,40,-1,1,40, "cube:.1")
plot3D(x, y, z, "cube:.1")
"ctext:text:i:j"
Defines a canvas text. The string text will be located at the canvas point (i, j) following java's convention to draw on a canvas, that is, the origin of coordinates is the top left corner of the canvas, the x axis runs positive to the right and the y axis run positive downward. The position of this text is not changed if you zoom or pan.
plot3D(f,-1,1,40-1,1,40, "ctext:20:50")
"font:name:size:style:color"
Set the current font using the given name. The size size is in pixels. The style style is one of these: plain, italic, bold, bolditalic. Options "atext" and "ctext" after will be drawn with the font just set.
plot3D(f,-1,1,40,-1,1,40, "font:Arial:20:bold:red")
"graymap"
"graymap:valmin:valmax"
Draws a surface plot using a gray scale. Values valmin and valmax are between 0 and 1, where 0 stands for black and 1 stands for white.
plot3D(f,-1,1,40,-1,1,40, "graymap:.2:.8")
"grid:color"
Uses color color to draw the grid.
plot3D(f,-1,1,40,-1,1,40, "grid:lightGray")
"hiddenlines"
Removes hidden lines from the plot. Uses a fast simple rendering algorithm with no color.
plot3D(f,-1,1,40,-1,1,40, "hiddenlines")
"labels:xlabel:ylabel:zlabel"
Places the text xlabel along the x axis, ylabel along the y axis and zlabel along the z axis.
plot3D(f,-1,1,40,-1,1,40, "labels:x:y:f(x,y)")
"light:nx:ny:nz"
Sets the vector that points to the source of light. The x axis is horizontal and the positive side is to the right of the user. The y axis is vertical and the positive side is up. The positive z axis points towards the user. The default value is "light:-1:1:1".
plot3D(f,-1,1,40,-1,1,40, "light:1:1:1")
"lightintensity:value"
Sets the intensity of the light source where value is in the range [-1,1]. The default value is 0.
plot3D(f,-1,1,40,-1,1,40, "lightintensity:-.7")
"mesh:color"
Draws a surface plot with a mesh using the specified color.
plot3D(f,-1,1,40,-1,1,40, "mesh:black")
"noaxes"
Removes the frame and tickmarks surrounding the plot.
plot3D(f,-1,1,40,-1,1,40, "noaxes")
"nogrid"
Removes the grid from the plot.
plot3D(f,-1,1,40,-1,1,40, "nogrid")
"nolight"
Removes the light source. Using this option, surface plots with only one color loose the sense of depth. However, this option is useful in combination with option "mesh".
plot3D(f,-1,1,40,-1,1,40, "nolight", "mesh:black")
"scale:cube"
Scales the axes in order to make the plot fit inside a cube.
plot3D(f,-1,1,40,-1,1,40, "scale:cube")
"scale:value"
Scales the z values by the specified value.
plot3D(f,-1,1,40,-1,1,40, "scale:5")
"scale:xvalue:yvalue:zvalue"
Scales all axes using the specified values.
plot3D(f,-1,1,40,-1,1,40, "scale:1:2:2")
"title:text"
Draws a title using the specified text.
plot3D(f,-1,1,40,-1,1,40, "title:Simple Variation")
"transparency:value"
Sets the transparency using the specified value in the range [0,1] where 0 stands for transparent and 1 stands for opaque. The default value is 1.
plot3D(f,-1,1,40,-1,1,40, "transparency:.5")
"view:azimuth:elevation"
Sets the position of the observer using the given azimuth and elevation angles.
plot3D(f,-1,1,40,-1,1,40, "view:30:20")
"wireframe"
Draws a wireframe plot of the function.
plot3D(f,-1,1,40,-1,1,40, "wireframe")
"xtickmarks:reference:value"
Draws the tickmarks in axis x using the spacing value such that a tickmarks would be located at x=reference.
plot3D(f,-1,1,40,-1,1,40, "xtickmarks:1:2.5")
"ytickmarks:reference:value"
Draws the tickmarks in axis y using the spacing value such that a tickmarks would be located at y=reference.
plot3D(f,-1,1,40,-1,1,40, "ytickmarks:1:2.5")
"ztickmarks:reference:value"
Draws the tickmarks in axis z using the spacing value such that a tickmarks would be located at z=reference.
plot3D(f,-1,1,40,-1,1,40, "ztickmarks:0:.2")